Infrastructure Dashboard
Visualizing data in an easily usable format
The Problem...
We had a server inventory database that had been created quite a few years before, however users could only view one server at a time, and had to use the overly-complex Microsoft SQL Reporting Services to get any useful data.
The Solution...
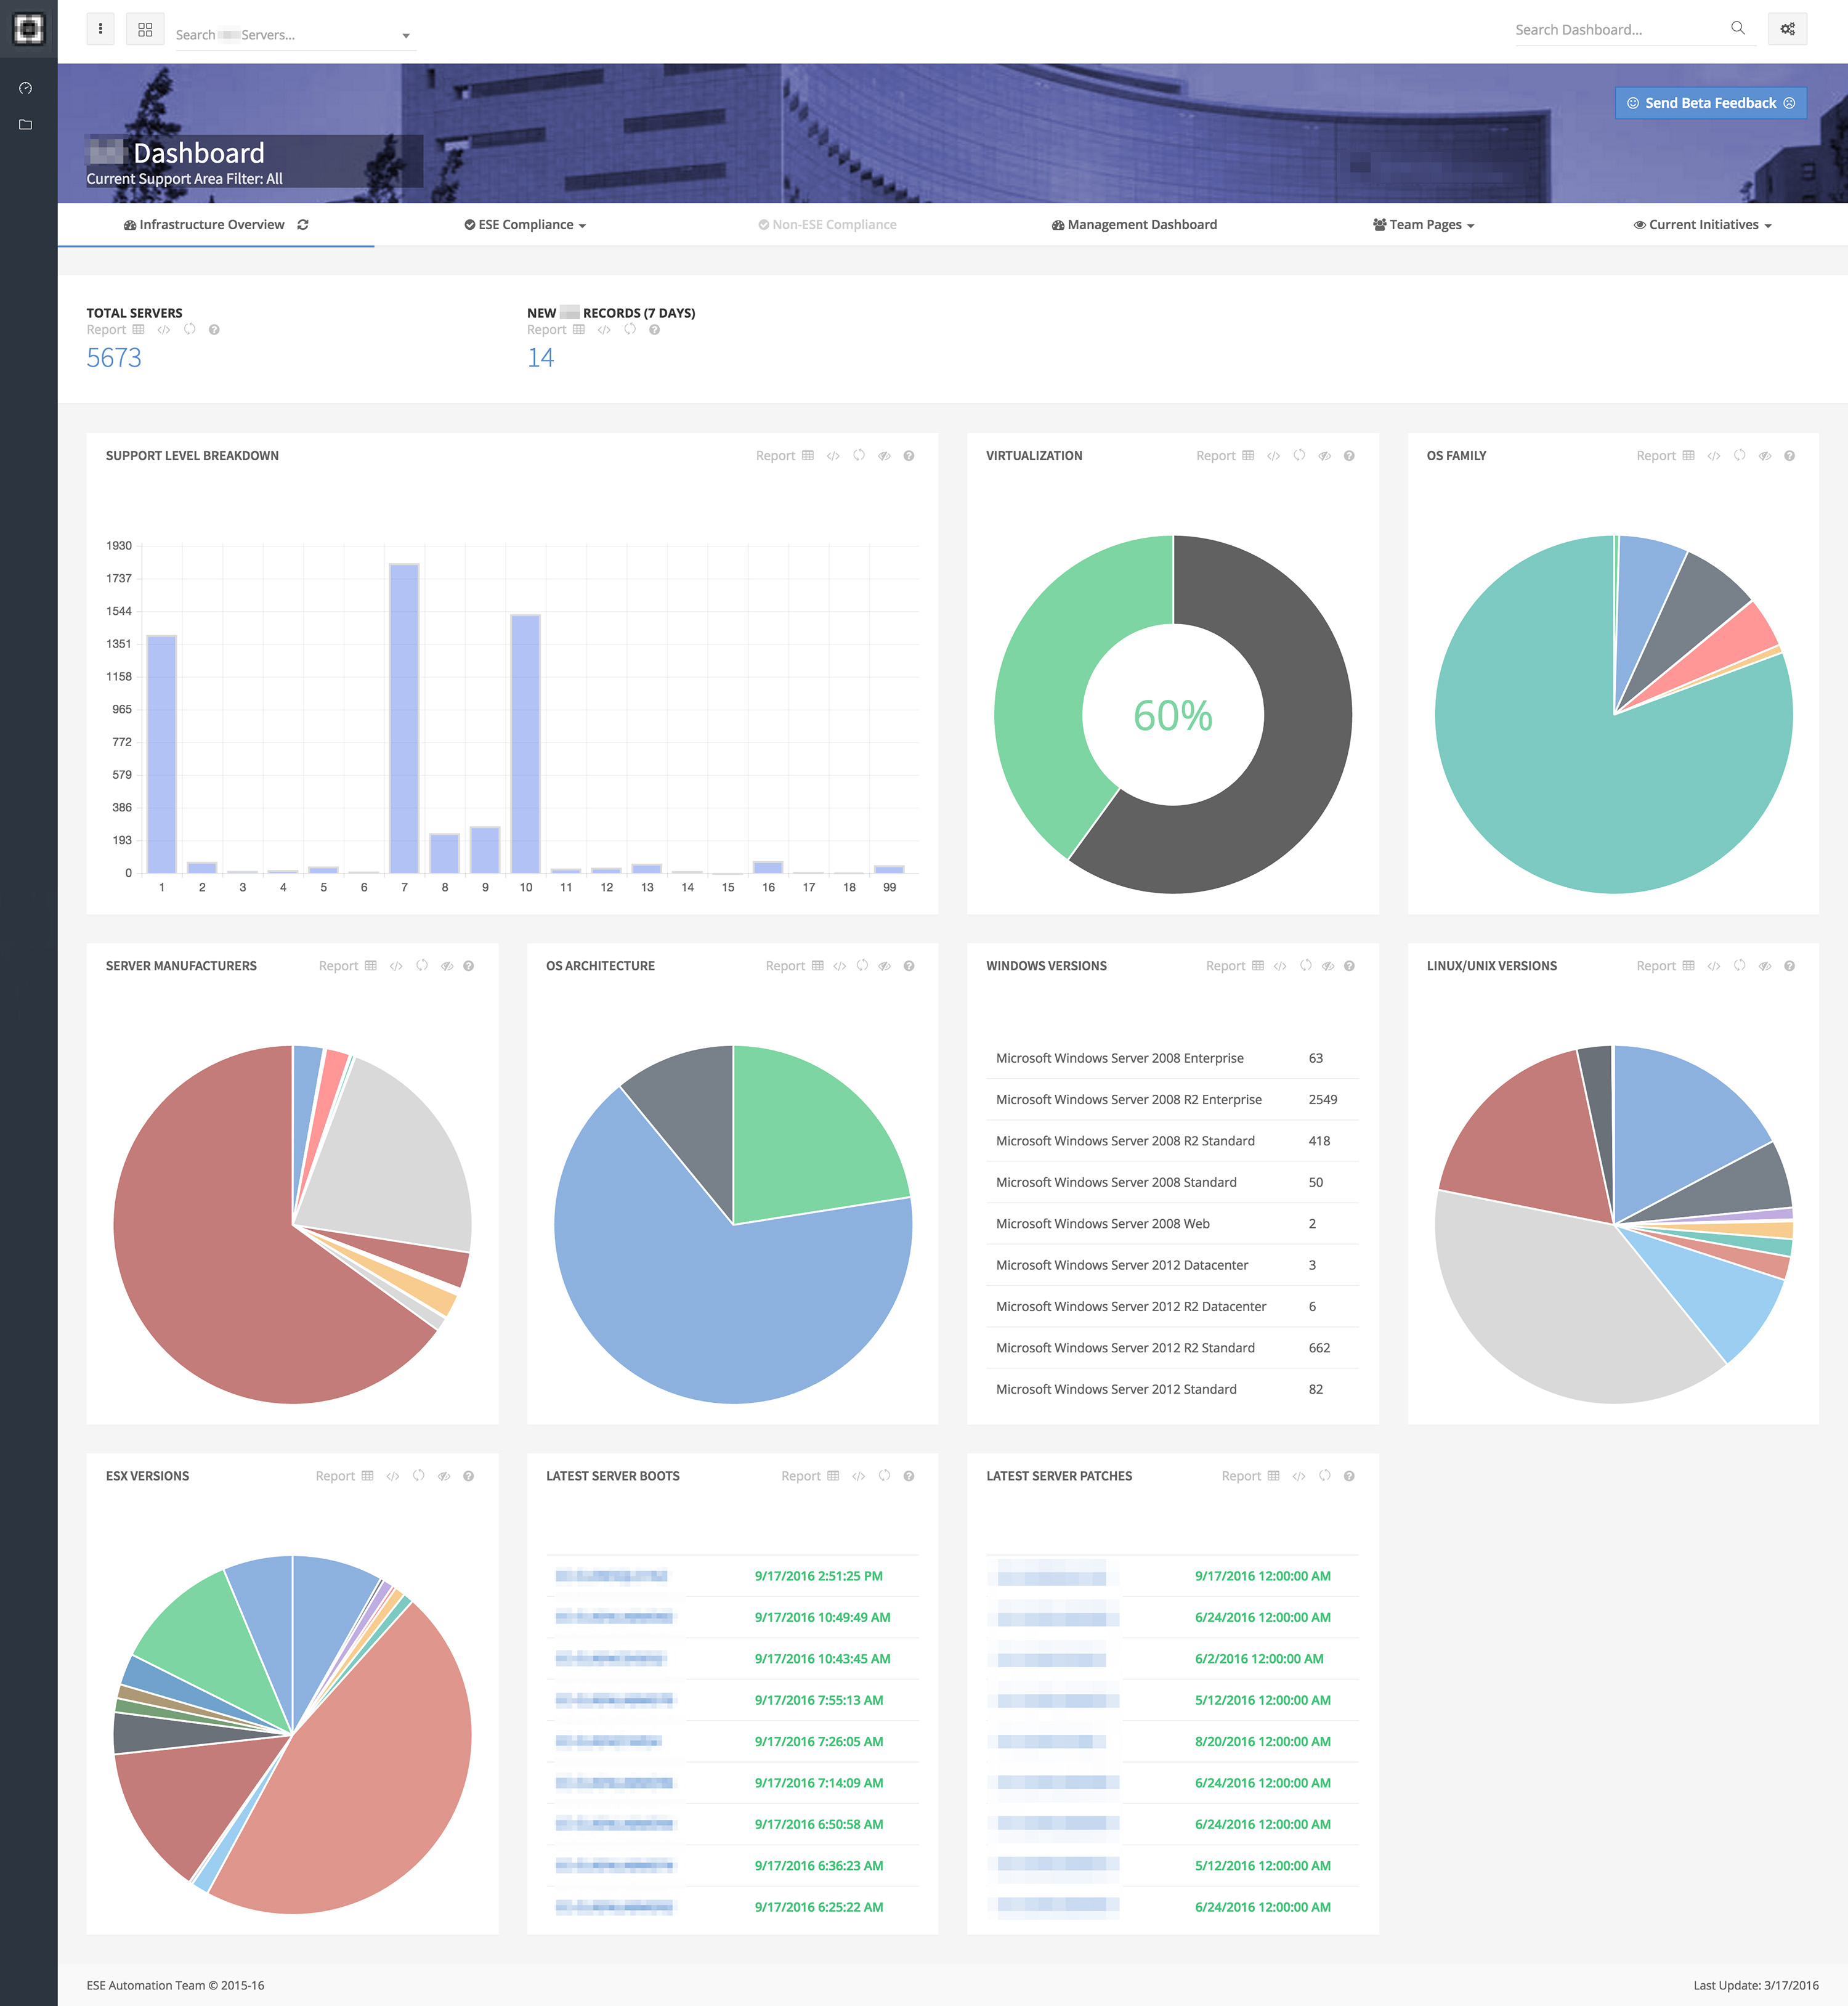
A dashboard, created using C# .NET MVC, and using various open source javascript libraries such as charts.js and datatables.js, allowing users to easily and intuitively view and use the data.
Features
Live information...
...from a SQL backend, regularly updated automatically by my inventory script
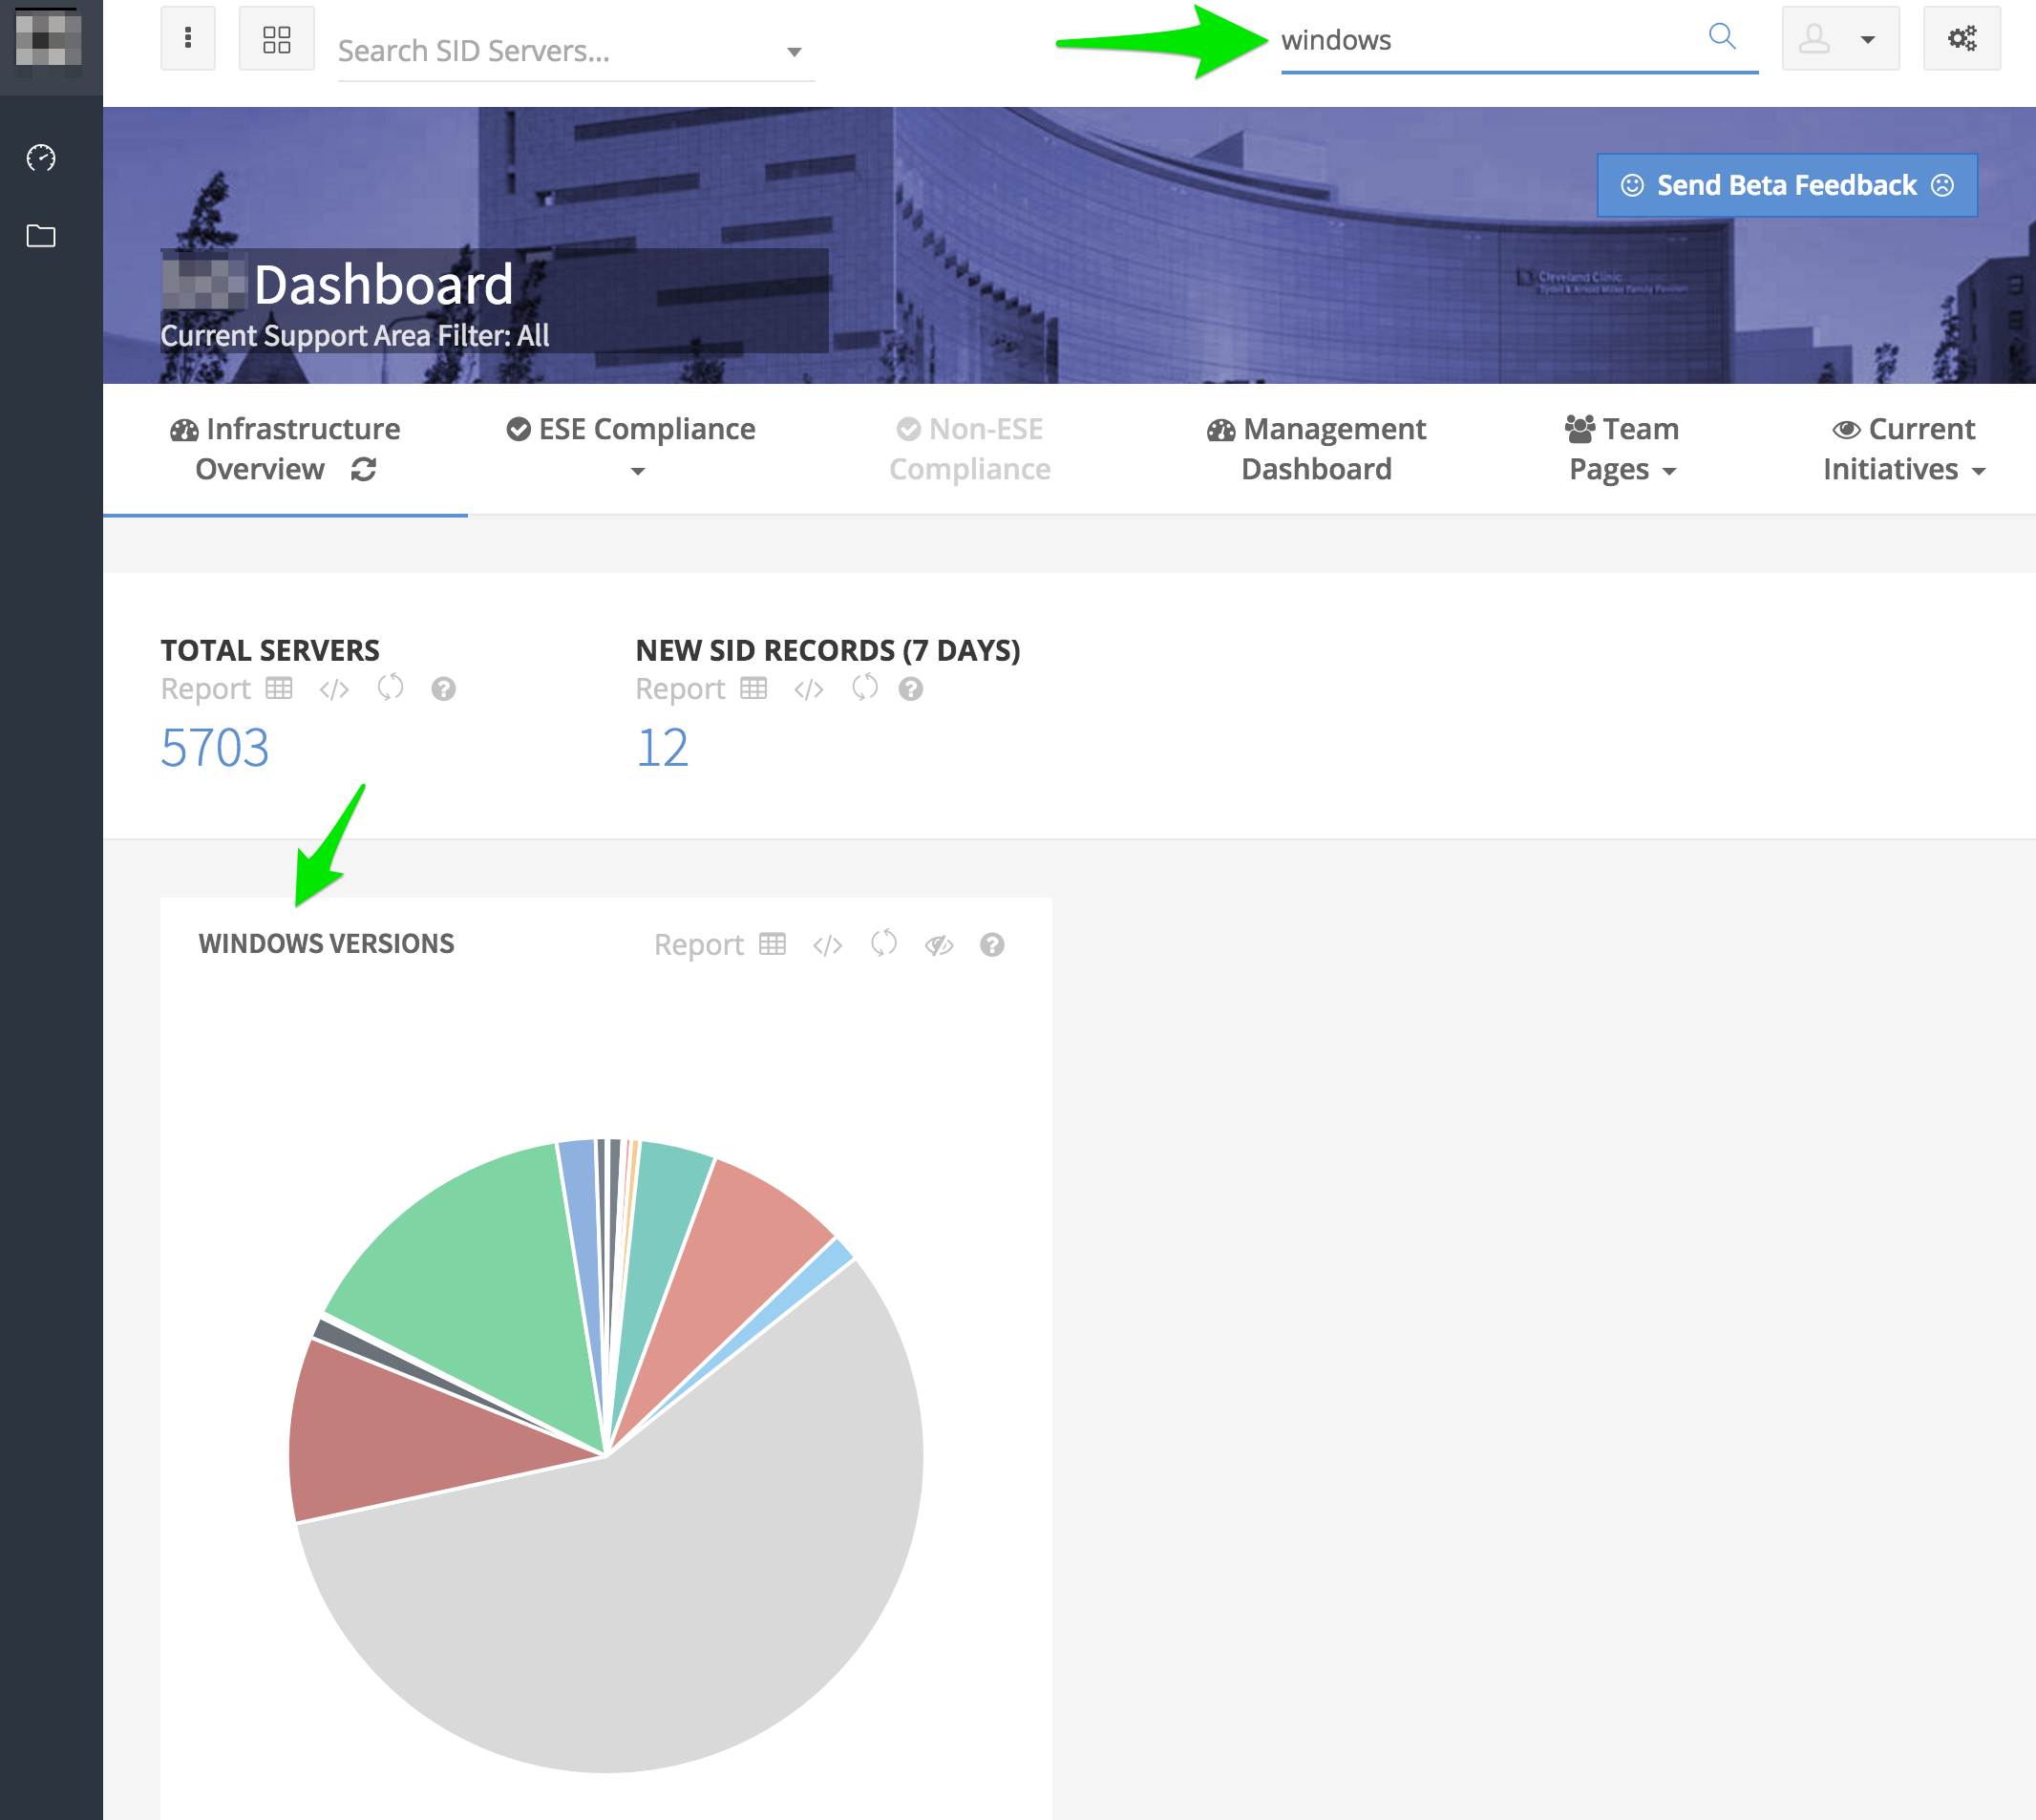
Every Page Searchable...
Every block on the dashboard has a corresponding...
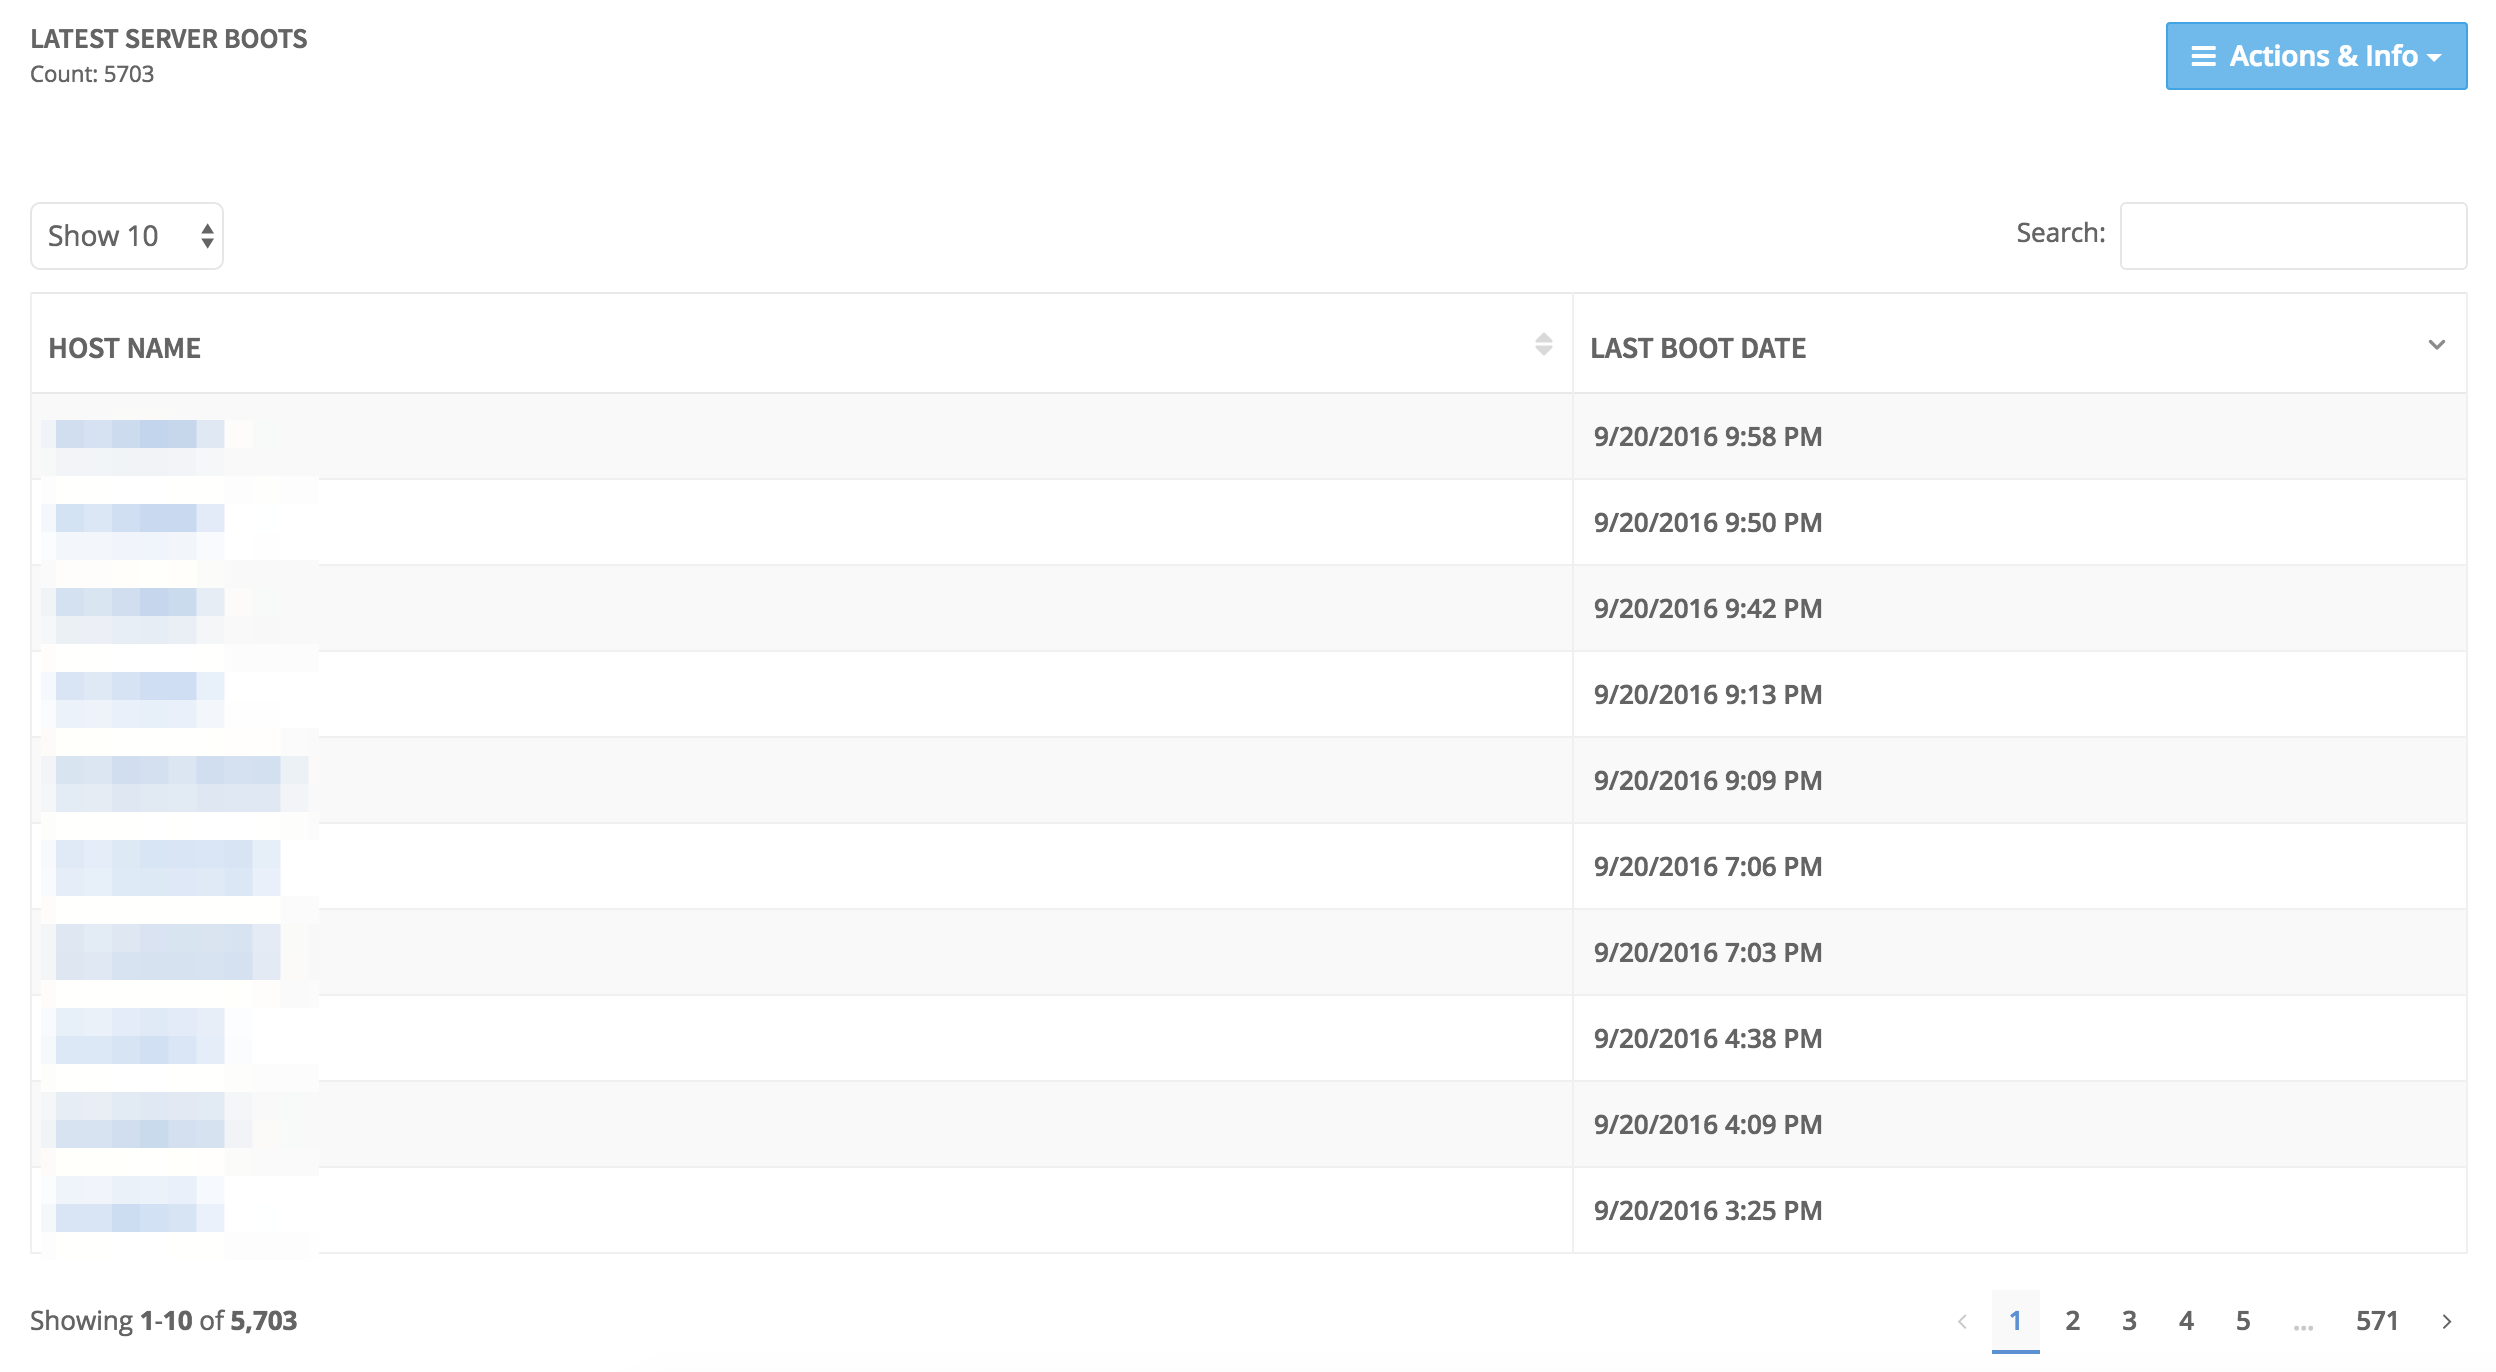
Full grid-based report...
...fully filterable and exportable, with configurable columns/fields
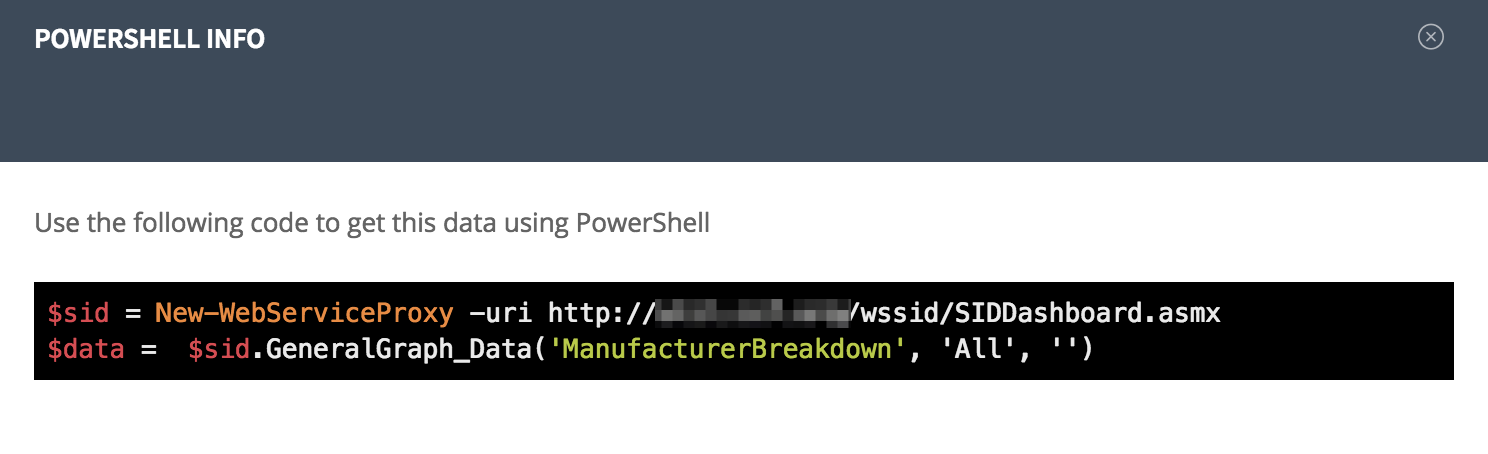
API code..
Individual refresh..
Contact me
Want to offer me a job?
Have a project you want me to work on?
Contact me, and I'll get right back to you.